
Project information
NYC Collision Data Warehouse
Introduction:
NYC publishes every police-reported motor vehicle collision in the city, but the raw feed is just one flat table with no structure and no repeatable way to answer a question as simple as
"where and when do collisions actually cluster?" This project builds a full cloud data warehouse pipeline to turn that raw feed into an analytics-ready model.
Approach:
Collision records were sourced directly from the NYC Open Data Web API and staged in Google Cloud Storage, timestamped on ingestion. The data was cleaned and transformed with Python,
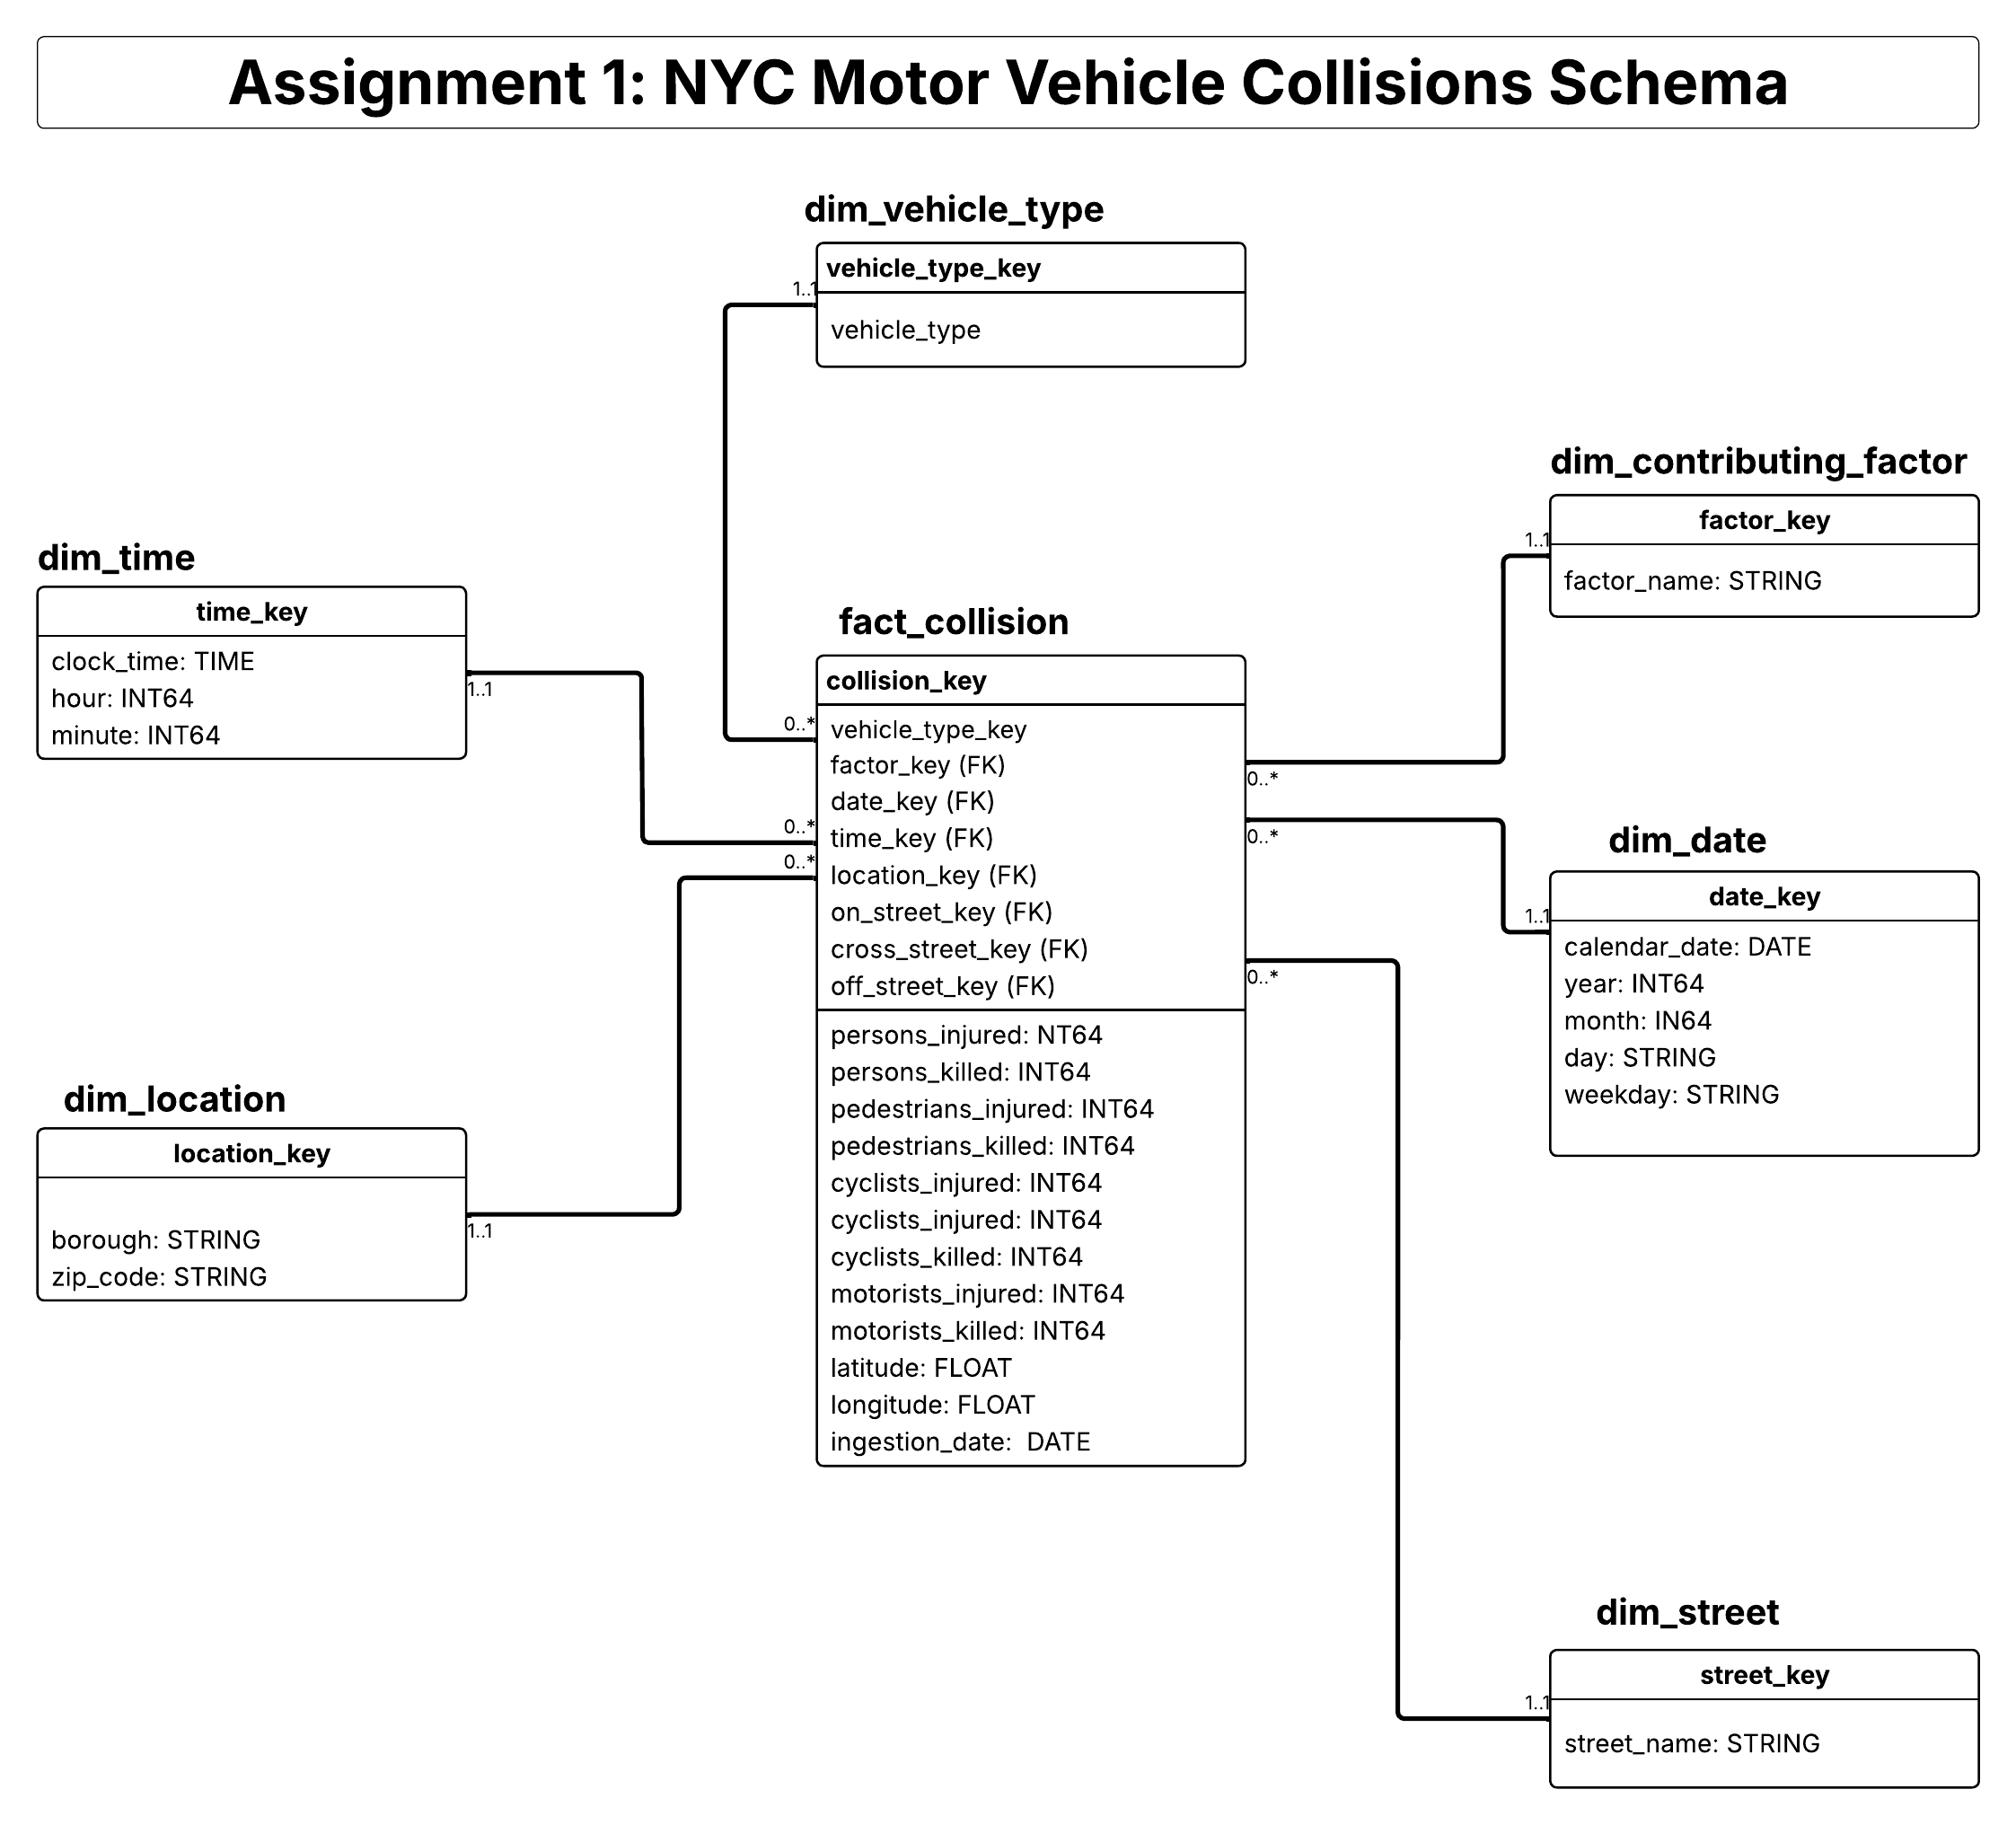
then modeled as a star schema in Google BigQuery: a central fact table (fact_collision) surrounded by six dimensions (date, time, location, street, vehicle type, and contributing factor).
The warehouse is served through an interactive Tableau dashboard, with pie, bar, line, and heat-map views driven by a live filter, plus a CSV export option that routes through the
BigQuery REST API for analysts.
Insight:
The model showed that Brooklyn accounts for 47% of all cyclist-involved collisions citywide, more than 2.5x the next highest borough.